Using Leaflet to design a Disc Golf Course
tldr; There is a quick 3-step process to make maps:
- Draft your map at geojson.io (because it's quick, has a good UI, supports multiple shapes and generates the JSON data).
- Copy/paste the JSON data into the GeoJson namespace on this site to "save" it for use or refinement.
- Use "#display_map" on any page on this site to embed/display the saved map data.
That's it!
From there, you can edit or revise the map data from either the display page, or the underlying data page. And, it's simple to copy/paste the JSON back and forth between here and GeoJSON.io too if you want to use that edit interface.
Example[edit]

The mapping capabilities of this site depend naturally on the Maps Extension. That wonderful extension supports map data in the GeoJson format.
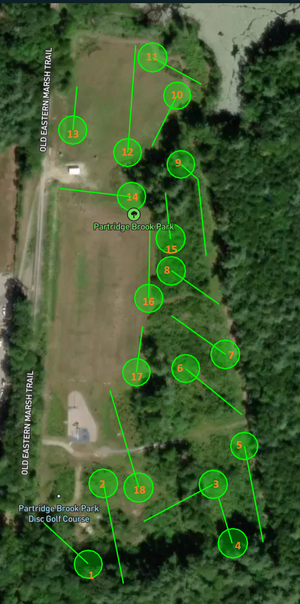
We used GeoJson.io to quickly come up with the JSON to design a 'back of the napkin' sketch of a Disc Golf Course. The process and results compared favorably to some of the other mapping tools. This is what I did for Partridge Brook Park Disc Golf Course
Step 1 Create JSON[edit]
Go to https://geojson.io and draw a map.
We ended up at https://geojson.io/#map=17.15/42.855467/-70.863373 where we could draw in the browser with a satellite imagery basemap and the JSON data is displayed in a panel next to the drawing.
Step 2: Create a page to save the JSON[edit]
We created GeoJson:PartridgeBrookParkDG and copy/pasted what we got from step 1.
(You can name the page whatever you like, but it has to be in the GeoJSON namespace).
Step 3: Display or embed the map on a content page.[edit]
Use the #display_map parser function to show your map on any content page.
You can edit the map from either the "display page", or the underlying map data page - it's the same data and result.
{{#display_map: center="-70.864801793366439,42.854582093535043" | geojson=PartridgeBrookParkDG | scrollwheelzoom=off | service=leaflet }} displays the data which is stored in GeoJson:PartridgeBrookParkDG, resulting in the map shown here.
Note: The alternate display_map tag syntax for the Maps extension is not compatible with GeoJSON data. In other words, this won't work: <display_map center="-70.864801793366439,42.854582093535043" geojson="PartridgeBrookParkDG" height="450px" scrollwheelzoom="off" service="leaflet"></display_map> That's because the tag syntax is ideal for showing multiple markers, each on their own line whereas GeoJSON is a data file.)
See Also[edit]
Using OpenStreetMaps to design a Disc Golf Course
Circles[edit]
While Leaflet does allow to draw circles with a point and a radius. The circles that you draw in GeoJson.io are not true circles. Instead they are polygons made up of dozens of points on an arc that approximate a circle. So, your data gets bulky and hard to edit.